Overview
Chart embedding allows you to display single saved charts from Lightdash in your application with a minimal, focused interface. Unlike dashboard embedding, chart embeds are scoped to a specific chart and provide a clean, distraction-free view of a single visualization.When to use chart embedding
- Single KPI displays: Show one key metric or visualization
- Embedded widgets: Add analytics widgets to application pages
- Marketing pages: Display metrics on public-facing pages
- Minimal UI requirements: When you need a clean, focused display
- Scoped access: Grant access to specific charts only, not entire dashboards
Key differences from dashboard embedding
| Feature | Dashboard Embedding | Chart Embedding |
|---|---|---|
| Embedding method | iframe or React SDK | React SDK only |
| Content | Multiple tiles, tabs | Single chart only |
| Filters | Interactive dashboard filters | No filters (pre-configured) |
| JWT scope | Dashboard UUID | Scoped to chart UUID |
| UI | Full dashboard interface | Minimal chart view |
| Explore | Can navigate to explore | Cannot access explore |
Available features
Chart embedding supports:- All chart types (bar, line, pie, table, big number, etc.)
- Parameterized charts with pre-set values
- Export to CSV (if enabled)
- Export to PNG/images (if enabled)
- View underlying data (if enabled)
Setup
Create an embed secret
Generate an embed secret for your project. This is the same secret used for all embedding types (dashboards, charts, explores).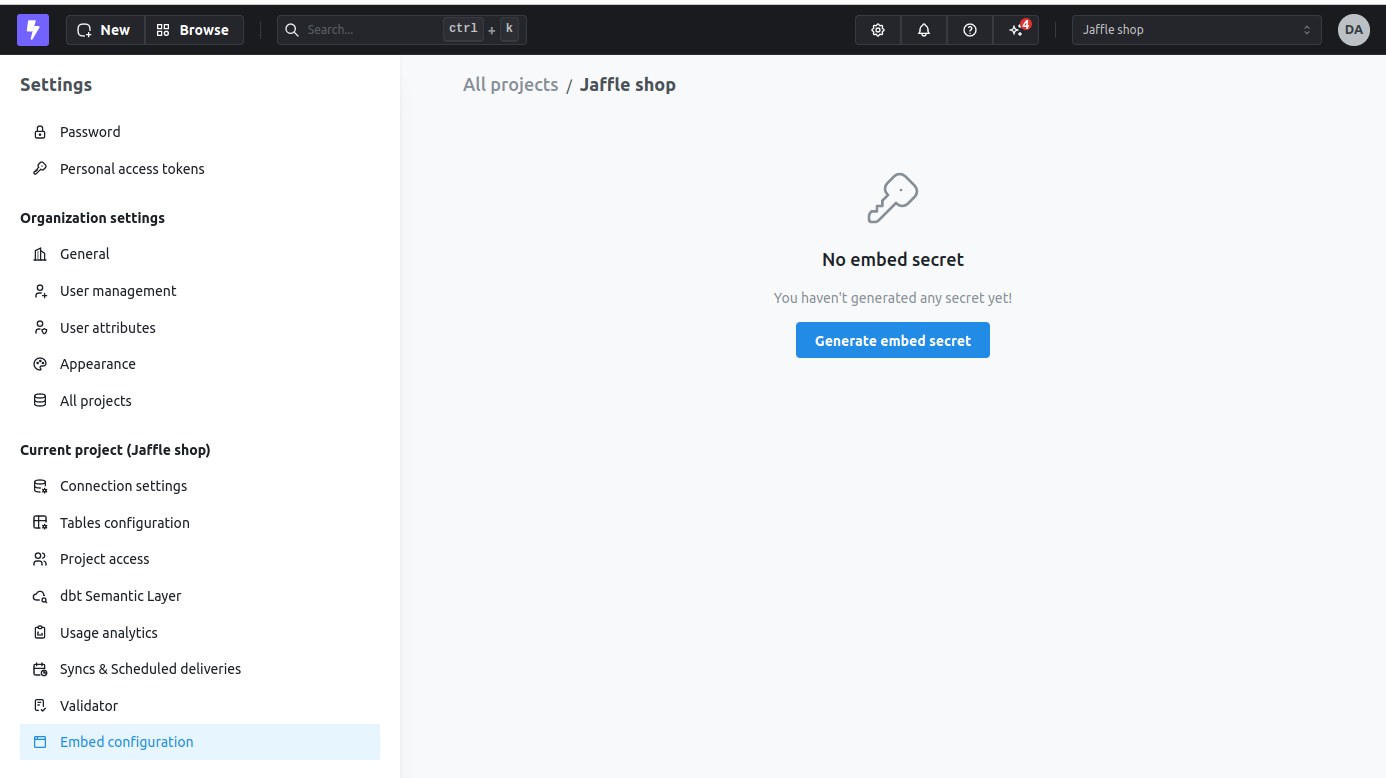
Configure allowed charts
Add the charts you want to embed to your project’s embed settings. Navigate to Settings → Embed and add specific charts to the allowed list.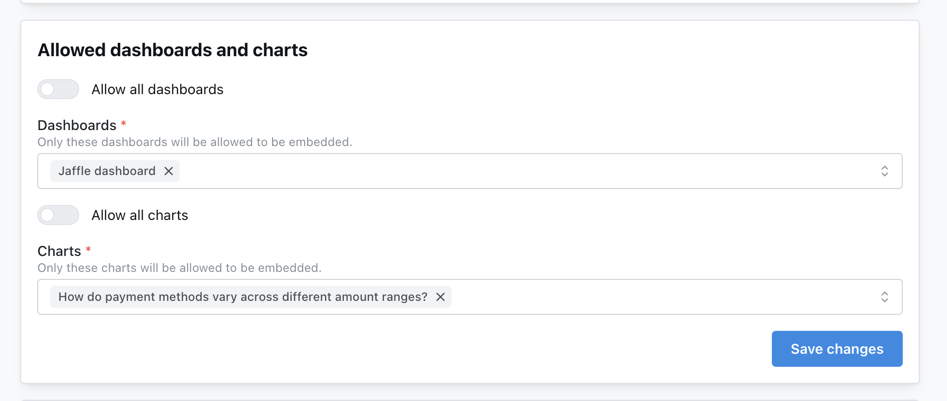
Embedding with React SDK
Chart embedding requires the Lightdash React SDK for seamless integration in your React application.See the React SDK reference for installation, setup, and complete configuration options.
Basic usage
Component props
Unlike the Dashboard component, Chart does not support
filters or onExplore props since charts are read-only and cannot navigate to explore.Advanced example with styling
Configuring features
Control what users can do with your embedded chart by configuring feature options. These options work for both iframe and React SDK embedding methods and are set in the JWT token.Export CSV
Export CSV allows users to download the raw data behind the chart as a CSV file, useful for further analysis in spreadsheet applications. Configure in JWT token:Export images
Export images allows users to download the chart visualization as a PNG image file, useful for presentations and reports. Configure in JWT token:View underlying data
View underlying data shows users the raw data table behind the chart, making it easy to inspect the actual values and records that create the visualization. Configure in JWT token:Complete configuration example
Limitations
Chart embeds have the following limitations compared to dashboard embeds:Cannot modify charts
Charts are always read-only. Users cannot:- Change dimensions or metrics
- Apply filters
- Modify chart configuration
- Change visualization type
No filter support
Charts use their saved filter configuration. You cannot:- Add interactive filters
- Apply filters programmatically via SDK
- Change filter values at runtime
No explore access
Users cannot:- Navigate to the explore view
- Access the underlying data model
- Run custom queries
- View or edit SQL
Scoped permissions
The JWT token is scoped to the specific chart UUID incontentId. Users cannot:
- Access other charts not in the token
- View project configuration
- Access explore metadata
If you need filter interactivity or exploration capabilities, consider using dashboard embedding instead or contact us with your use-case.
Use cases and examples
Single KPI widget
Display a key performance indicator in your application dashboard:Embedded metric in marketing page
Show a public-facing metric on your website:Parameterized chart
Display a chart with pre-set parameter values:Parameter values are set when the chart is saved. Chart embeds display the chart with its saved parameter configuration.
Advanced features
User metadata for analytics
Pass user information to track who’s viewing your embedded charts.Custom styling (SDK only)
Apply custom styling to match your application’s design.Localization (SDK only)
Translate embedded charts using thecontentOverrides prop. See React SDK localization for details.