Embedding is available to all Lightdash Cloud users, get in touch to have this feature enabled in your account. Overview
Dashboard embedding allows you to display full Lightdash dashboards in your application with multiple visualizations, filters, and interactive features. This is ideal when you want to provide comprehensive analytics views to your users.
When to use dashboard embedding
- Executive dashboards: Display multiple KPIs and metrics in admin panels
- Customer-facing analytics: Provide analytics portals for SaaS customers
- Embedded reporting: Integrate comprehensive data views into your workflows
- Multi-chart views: Show related visualizations together with shared filters
Key features
- Multiple chart tiles and markdown content
- Dashboard-level filters (interactive if enabled)
- Multiple tabs for organizing content
- Parameters support
- Export options (CSV, images, PDF)
- Date zoom for time-series charts
- “Explore from here” to navigate to query builder
- View underlying data for any visualization
Setup
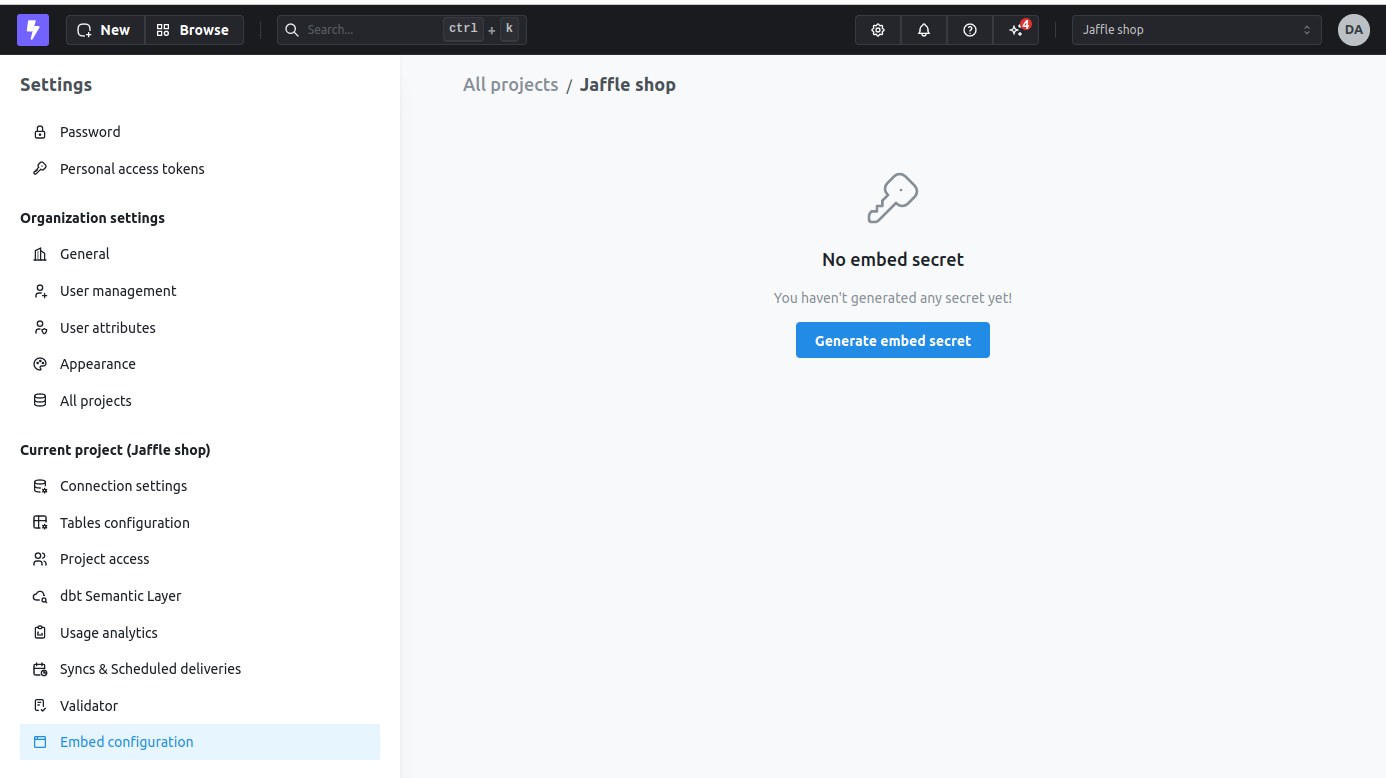
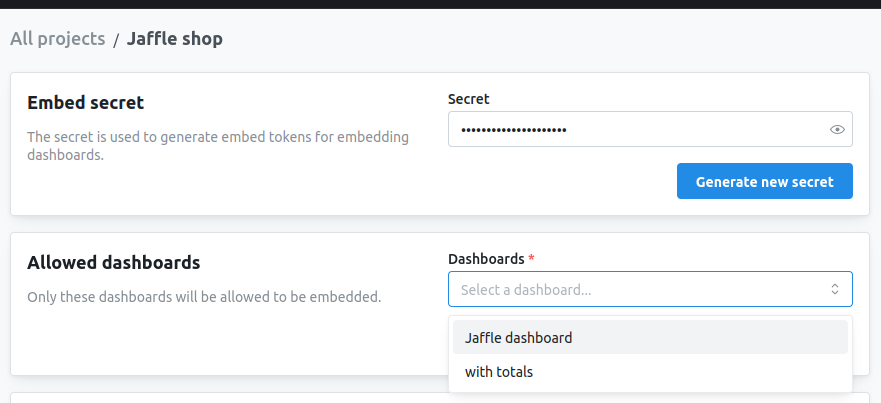
Create an embed secret
First, generate an embed secret for your project. This secret is used to sign JWT tokens that authenticate embed requests.
Keep your embed secret secure! Never expose it in frontend code. Always generate JWT tokens server-side.
Configuring interactivity
Control what users can do with your embedded dashboard by configuring interactivity options. These options work for both iframe and React SDK embedding methods and are set in the JWT token.
While the SDK options are configured via React props, iframe options are configured in the admin UI where you setup the embedding:
Dashboard filters
Dashboard filters allow users to slice and filter data across all charts in the dashboard. You can control whether users can interact with these filters, which filters they can modify, and whether the filter UI is visible.
Configure in JWT token:
{
  content: {
    type: 'dashboard',
    dashboardUuid: 'your-dashboard-uuid',
    dashboardFiltersInteractivity: {
      enabled: 'all',  // 'all', 'some', or 'none'
    },
  }
}
'all' - All dashboard filters are interactive and visible'some' - Only specified filters are interactive (use allowedFilters array)'none' - Filters are applied but not visible or editable
Allow specific filters only:
{
  content: {
    type: 'dashboard',
    dashboardUuid: 'your-dashboard-uuid',
    dashboardFiltersInteractivity: {
      enabled: 'some',
      allowedFilters: ['filter-uuid-1', 'filter-uuid-2'],
    },
  }
}
{
  dashboardFiltersInteractivity: {
    enabled: 'all',
    hidden: true,  // Filters work but UI is hidden
  }
}
Parameters
Parameters are dynamic values that can be referenced in your queries and filters. When enabled, users can modify parameter values to change what data is displayed across the dashboard.
Configure in JWT token:
{
  content: {
    type: 'dashboard',
    dashboardUuid: 'your-dashboard-uuid',
    parameterInteractivity: {
      enabled: true,
    },
  }
}
Export options
Allow users to export data and visualizations from the embedded dashboard. You can control which export formats are available.
Configure in JWT token:
{
  content: {
    type: 'dashboard',
    dashboardUuid: 'your-dashboard-uuid',
    canExportCsv: true,        // Export chart data as CSV
    canExportImages: true,     // Export charts as PNG/images
    canExportPagePdf: true,    // Export entire dashboard page as PDF
  }
}
- CSV - Download raw data from individual charts
- Images - Export charts as PNG images
- PDF - Export the entire dashboard page as a PDF document
Date zoom
Date zoom allows users to dynamically change the time granularity of time-series visualizations (e.g., view by day, week, month, quarter, year) without modifying the underlying query.
Configure in JWT token:
{
  content: {
    type: 'dashboard',
    dashboardUuid: 'your-dashboard-uuid',
    canDateZoom: true,
  }
}
Explore from here
“Explore from here” allows users to navigate from a dashboard chart into the full query builder interface, where they can modify dimensions, metrics, filters, and create ad-hoc analyses starting from the chart’s configuration.
Configure in JWT token:
{
  content: {
    type: 'dashboard',
    dashboardUuid: 'your-dashboard-uuid',
    canExplore: true,
  }
}
View underlying data
View underlying data shows users the raw data table behind any visualization, making it easy to inspect the actual values and records that create the chart.
Configure in JWT token:
{
  content: {
    type: 'dashboard',
    dashboardUuid: 'your-dashboard-uuid',
    canViewUnderlyingData: true,
  }
}
Complete configuration example
import jwt from 'jsonwebtoken';

const token = jwt.sign({
  content: {
    type: 'dashboard',
    projectUuid: 'your-project-uuid',
    dashboardUuid: 'your-dashboard-uuid',

    // Filter controls
    dashboardFiltersInteractivity: {
      enabled: 'all',
    },

    // Parameter controls
    parameterInteractivity: {
      enabled: true,
    },

    // Export capabilities
    canExportCsv: true,
    canExportImages: true,
    canExportPagePdf: true,

    // Interactive features
    canDateZoom: true,
    canExplore: true,
    canViewUnderlyingData: true,
  },

  // User information (for analytics)
  user: {
    externalId: 'user-123',
    email: 'user@example.com',
  },

  // User attributes (for row-level filtering)
  userAttributes: {
    tenant_id: 'tenant-abc',
  },
}, LIGHTDASH_EMBED_SECRET, { expiresIn: '1h' });
iframe embedding
iframe embedding is the simplest way to embed dashboards. No special libraries or dependencies required.
URL structure
https://your-instance.lightdash.cloud/embed/{projectUuid}/dashboard/{dashboardUuid}#{jwtToken}
https://your-instance.lightdash.cloud/embed/{projectUuid}/dashboard/{dashboardSlug}#{jwtToken}
Generate JWT token
import jwt from 'jsonwebtoken';

const LIGHTDASH_EMBED_SECRET = process.env.LIGHTDASH_EMBED_SECRET;
const projectUuid = 'your-project-uuid';

const token = jwt.sign({
  content: {
    type: 'dashboard',
    dashboardUuid: 'your-dashboard-uuid',
  },
}, LIGHTDASH_EMBED_SECRET, { expiresIn: '1h' });

const embedUrl = `https://app.lightdash.cloud/embed/${projectUuid}/dashboard/your-dashboard-uuid#${token}`;
Embed in HTML
<iframe
  src="https://app.lightdash.cloud/embed/project-uuid/dashboard/dashboard-uuid#jwt-token"
  width="100%"
  height="600"
  frameborder="0"
  style="border: none;"
></iframe>
React SDK
The React SDK provides seamless integration with additional features like programmatic filters, callbacks, and styling.
Basic usage
import Lightdash from '@lightdash/sdk';

function MyDashboard() {
  return (
    <Lightdash.Dashboard
      instanceUrl="https://app.lightdash.cloud"
      token={tokenFromServer}
    />
  );
}
Component props
type DashboardProps = {
  instanceUrl: string;                    // Required: Your Lightdash instance URL
  token: string | Promise<string>;        // Required: JWT token
  styles?: {
    backgroundColor?: string;             // Dashboard background color or 'transparent'
    fontFamily?: string;                  // Font family for text
  };
  filters?: SdkFilter[];                  // Apply filters programmatically
  contentOverrides?: LanguageMap;         // Translation/localization overrides
  onExplore?: (options: { chart: SavedChart }) => void;  // Callback when user navigates to explore
};
Advanced example with filters
import Lightdash, { FilterOperator } from '@lightdash/sdk';

<Lightdash.Dashboard
  instanceUrl="https://app.lightdash.cloud"
  token={await generateToken()}
  filters={[
    {
      model: 'orders',
      field: 'status',
      operator: FilterOperator.EQUALS,
      value: 'completed',
    },
    {
      model: 'orders',
      field: 'created_date',
      operator: FilterOperator.IN_BETWEEN,
      value: ['2024-01-01', '2024-12-31'],
    },
  ]}
  styles={{
    backgroundColor: '#f5f5f5',
    fontFamily: 'Inter, sans-serif',
  }}
  onExplore={({ chart }) => {
    console.log('User exploring chart:', chart.name);
  }}
/>
Advanced features
Pass user information to track who’s viewing your embedded dashboards.
{
  user: {
    externalId: 'user-123',       // Your internal user ID
    email: 'user@example.com',    // User's email
  }
}
Custom styling (SDK only)
Apply custom styling to match your application’s design.
<Lightdash.Dashboard
  instanceUrl="https://app.lightdash.cloud"
  token={token}
  styles={{
    backgroundColor: 'transparent',
    fontFamily: 'Helvetica, Arial, sans-serif',
  }}
/>
Localization (SDK only)
Translate embedded dashboards using the contentOverrides prop. See React SDK localization for details.
Row-level security with user attributes
Filter data based on the viewing user’s properties. See the user attributes reference for complete details.
Next steps